
Most of the conversations I have with our web editors about Google Analytics start like this:
Editor: I’ve got access to Google Analytics but I didn’t know where to start. There’s so much data, it’s overwhelming!
Me: We know how daunting Google Analytics can be, so we’ve created a standard dashboard you can copy and customise to get all the key metrics for your website.
It’s true. With our standard dashboard you can get data on:
- how people are getting to your site
- the keywords people are using to find your site
- what devices people are using to access your site
- the location of your audience
- your most popular pages
- the total number of visitors to your site
- whether your visitors are new or returning
Here’s an example of what your dashboard will look like. This one is set up for the About section of the University website.
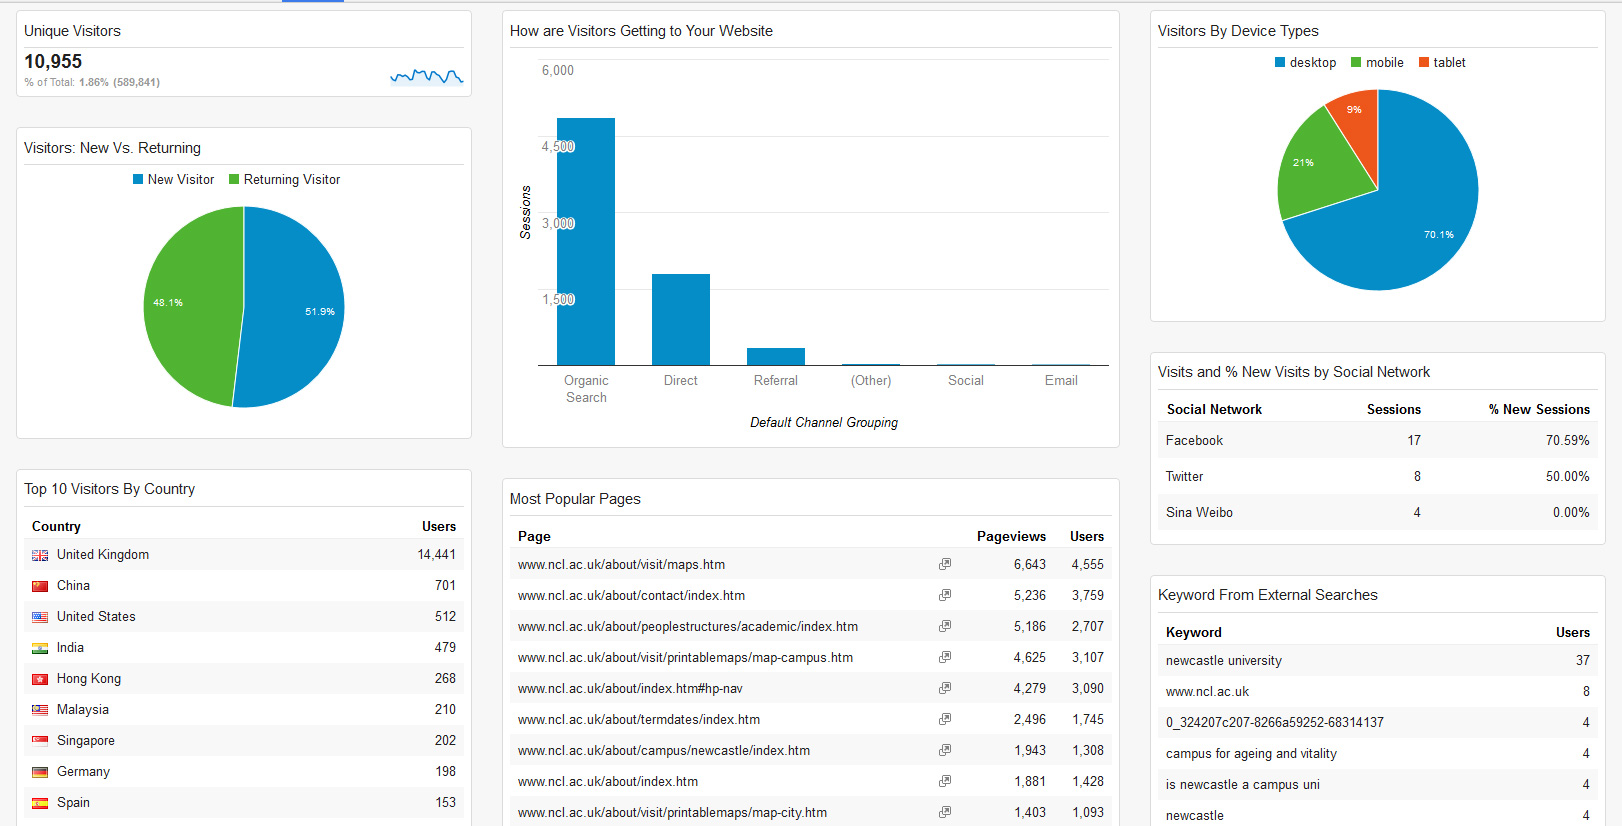
Customised Google Analytics dashboard for www.ncl.ac.uk/about
Once you’ve got the dashboard set up you can:
- view data for different time periods
- download the report as a PDF
- schedule reports to be emailed to you on a regular basis.
The first step to getting the dashboard is to request access to the University’s Google Analytics (University login required). Once you have access you can customise the standard dashboard for your website. We’ve got step-by-step instructions on how to do this, plus a demo video on our website (University login required).
Our next post will cover how to make use of the data in your dashboard. If there are other analytics topics you’d like us to cover please leave us a comment below.
