Like many of our web editors, I found Google Analytics a bit daunting at first. The vast amount of information available made me think, where do I start? And how do I use and interpret the data?
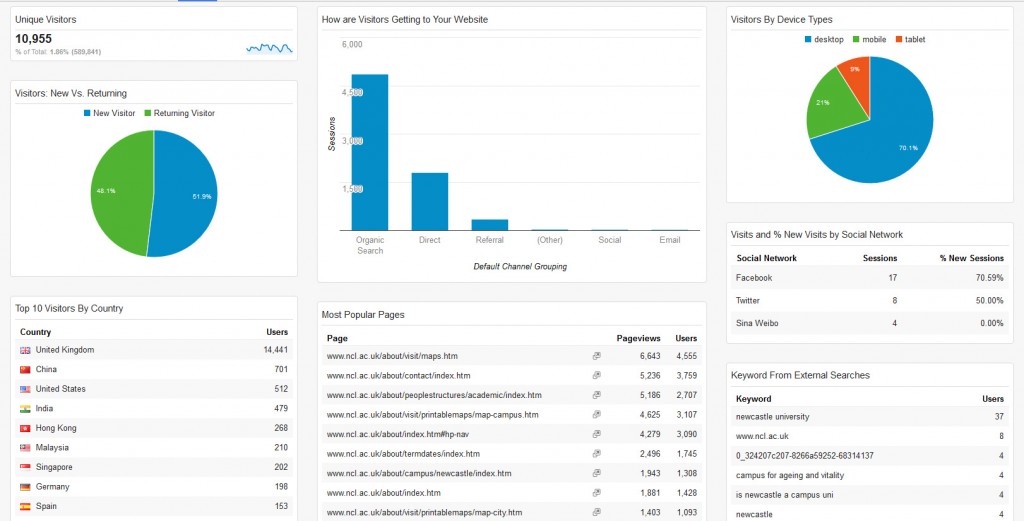
Earlier this week Emma wrote about how our standard dashboard is a good starting point for analytics in her post How to Create a Customised Google Analytics Dashboard.
I’m going to take this further to focus on how we can use analytics to help evaluate and improve web content. To do this, I’ve looked at the standard dashboard for one of the sites in Go Mobile – the Undergraduate Open Day website. The data referenced is from 25 May to 28 June (about a month before the Open Days).
Read on to learn about my findings…
How visitors get to your site
The analytics show that around half of the visits (50.1%) to the site were made through a search engine, such as Google. This shows the importance of search engine optimisation (SEO). For advice on improving your SEO read our posts on search.
If we look at traffic to the site from social media the analytics show that the majority of visits via social networks came from Twitter. The Open Day team need to decide whether they want to concentrate efforts on the most popular social network or to focus on increasing traffic from other networks, like Facebook.
Keyword searches
Our standard dashboard shows keywords people searched for to get to your site, both in search engines and in the onsite search.
Some of the keywords identified for the Open day site were:
- campus tours
- medicine
- law
- accommodation
These words show the types of content visitors were looking for on the Open Day site. It’s therefore important that the site contains content on these topics, even if it’s just to provide some context and a link to further information on another University website.
The keyword search also shows the terms visitors are using to find this content. Using the language of your visitors increases the likelihood that they will find the information they’re searching for.
Most popular pages
As part of our Go Mobile training, we’re advising our editors to prioritise the content they’re editing on their website. To help identify which pages to prioritise we’re using an idea called the Core Model. This identifies pages where user tasks and business goals meet – these are the core pages of your website. You should focus your efforts on improving these first.
The main user task for the Open Day site is to book a place at the event, and the main business goal for this site is to increase Open Day bookings. The Book your Place page is therefore a core page of the site and the analytics supports this.
The most popular pages in this period were the Book your Place page, followed by the Open Day homepage and the Traveling to the University page.
Finding out which pages are most popular can help you to identify and prioritise core pages.
It’s important that you don’t take this data at face value though – just because a page isn’t popular doesn’t necessarily mean that the content isn’t important to yours users. Look again at the page. Is it easy enough to find? Does it use the language of your users? Does it contain all of the relevant information? Is the content engaging and clear?
Devices used to access site
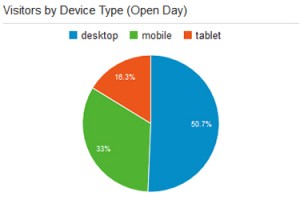
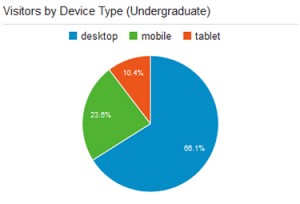
The analytics show that 50.7% of visitors viewed the site on a desktop during this period.The remaining 49.3% were accessing the site via a mobile or tablet. This is in contrast to the Undergraduate website where 66.1% of visitors accessed the site via desktop during the same period.


The split between desktop and mobile could be more equal for the Open Day site because it’s an event website. It is therefore used in a different way by prospective students. Visitors are more likely to quickly check key details on their phones when they are preparing for or travelling to the event.
This reinforces the idea that we need to write web content that translates across devices so that we don’t exclude any of our audiences.
Summary
What I’ve found about using Google Analytics is that it all comes down to what you’re trying to achieve with your site. This will inform what data you need to look at.
Analytics is a useful tool and can tell you a myriad of things to help improve your web content, but it’s always best to look at the data in context. If visitors aren’t engaging with a page or piece of content in the way that you expect don’t just write it off as unimportant. Instead think about why it might not be working, and whether you need to re-think the content or where it sits on the site.


