We are delighted to share that our colleagues Leonard Shapiro, Iain Keenan and student Ella Hobbs have had their work on Haptic Surface Painting (HSP) published.
The paper describes the development and evaluation of haptic surface painting (HSP), a novel body painting approach that has been designed to support learner exploration and observation of anatomy. HSP involves the use of touch, sight, and food colouring to locate and paint the positions of muscles, tendons, ligaments, and bones directly on to the skin. Having used HSP, medical students identified that the approach was accessible, flexible, and empowering, and provided positive impacts on their three-dimensional spatial awareness and cognitive freedom when studying clinically relevant anatomical concepts.
As part of work on the Exploring 3D Anatomy MOOC, brought to life with help from FMS TEL, Iain and Leonard have also developed this as an asynchronous workshop that students can follow at home with video guidance. This, alongside other Exploring 3D Anatomy exercises are available as a free course to a wider audience.
The MBBS programme collects a lot of assessment information that needs to be displayed in a way that is useful for the students, so that they can improve their grades through focusing on the right areas. They called upon the web skills of the FMS TEL team to design and implement a web application that could take assessment results, process them, and show them to the students in a visual and interactive way.
Using templates
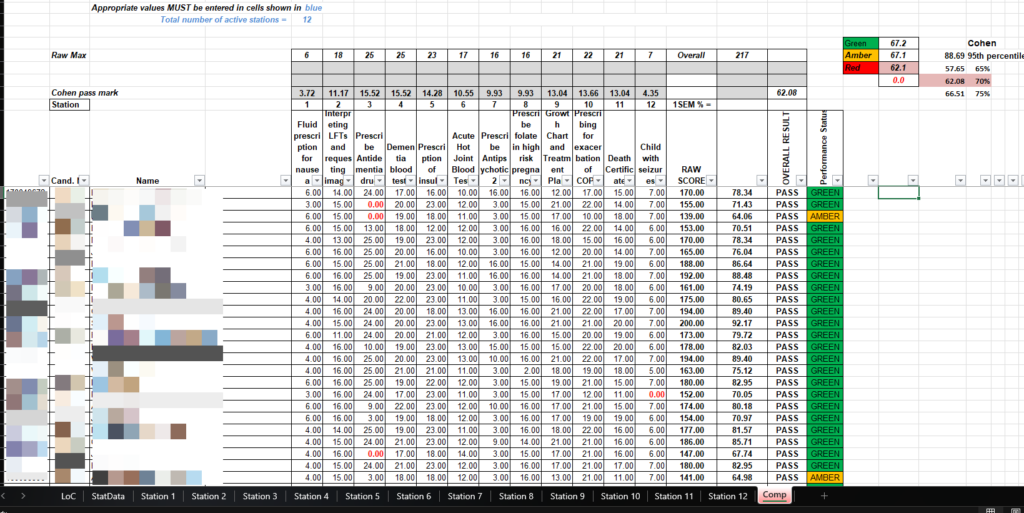
The first step towards this was agreeing a template that the results could be stored in. The types of assessments the MBBS programme uses are varied and quite detailed in their scope. They required a means to take all of this variation and detail and create something useable. The assessment team started by using complex Excel documents to collect and store all the assessments results. Each assessment type (WriSkE, MOSLER, SBA, OSCE…) needed a unique Excel template to store all the student scores and a way to map the assessment structure to the curriculum outcomes.
Example WriSkE template
Processing the Spreadsheets
Once we had agreed on the template structure, we could then focus on how we would process them for use in a web application. We planned for the heavy concurrent use the web application would undergo when all the students logged in and tried to access their grades at the same time. The best solution for this was to minimise the use of complex database structures and instead store the results in pre-processed files, one for each student per assessment. The format we chose for this was JSON and this allowed us to rely on the speed of the server to provide the data.
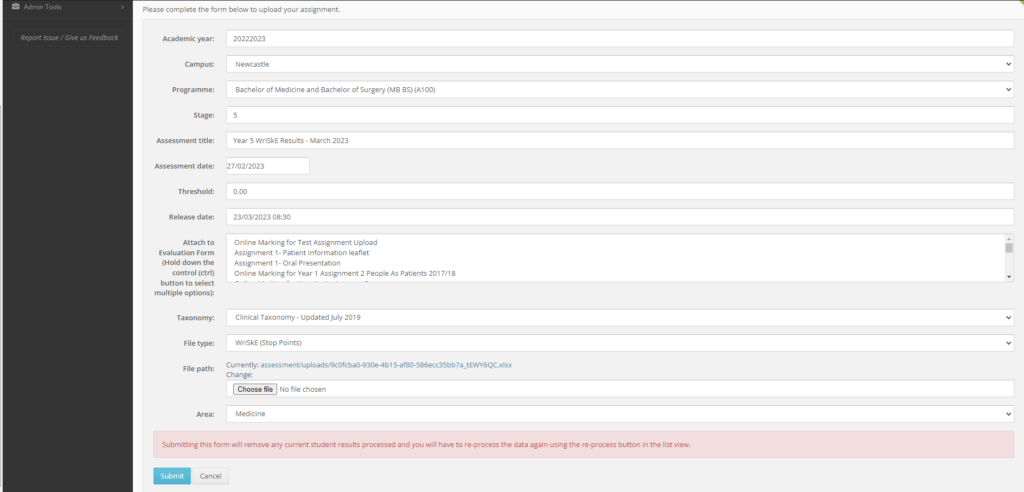
Custom processing scripts were written for each assessment type to create these files. This would mean an administrator from the assessment team could log in to the site, go to the admin tools, choose an assessment type, set up a few settings including a release date, attach the assessment to an uploaded taxonomy (this attached the exam structure to learning outcomes), attach Excel file and process. The site would then go through the spreadsheet and create each assessment file ready for the students.
Admin Upload Form
Display the Results
The final step was to decide how to display this detailed assessment information to the student. We chose to use an online chart library called highcharts. This allowed us to utilise a whole suite of charts and graphs to display the raw results in an interactive way.
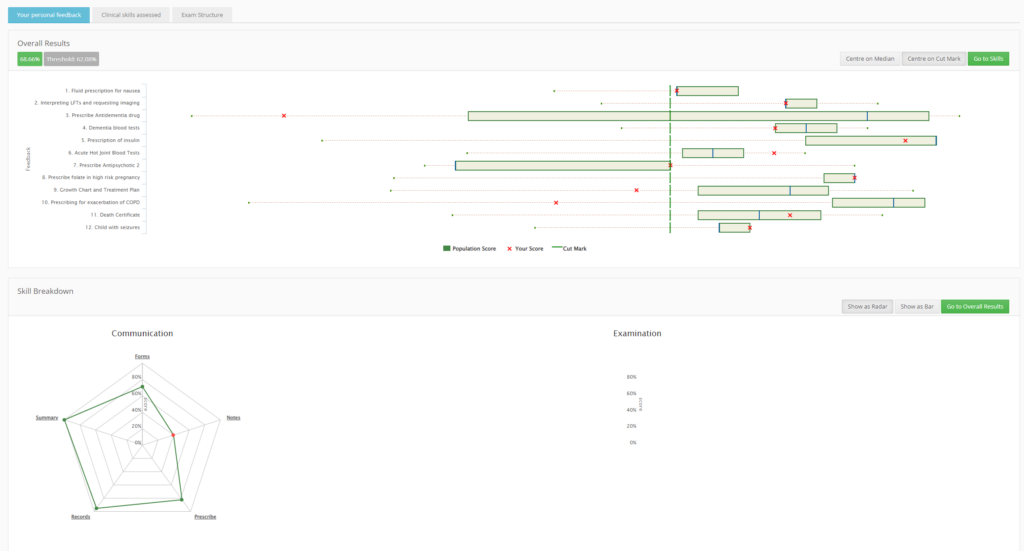
One of the core charts we used was quartile (boxplot) graphs, which allowed us to plot the students scores against the cohorts. This means that students can see how they are performing in the context of their cohorts, which many of them appreciate. We also heavily use bar charts you can drill down into, and spiderweb charts that could show the same information in a visually different way. Letting the students modify and change the display to their preferences was also key.
Finally, we added tabs to show the exam structure and an area to which support documents could be added, such as assessor comments.
WriSkE results of a student
Each time a student clicked on an assessment, the site would load their file and convert into a visually rich interface of charts, graphs and links to drill down into the data.
System Success and Expansion
The FMS Feedback system has been successfully used by the MBBS programme since 2014. It is held in high regard by the administrative team who appreciate its flexibility and ease of use. For students, the detailed data displayed allows them to have a very granular understanding about their levels of mastery of individual skills and topic areas, and to spot patterns in their performance. This means they can focus their studies on areas identified for improvement, with a view to increasing their overall competency.
It has since been expanded to cover a few assessments from dental programmes that had a similar structure and process to the original MBBS assessments, such as SBA and OSPE’s.
If you would like to learn more about the FMS Feedback system, please contact the FMS TEL Team.