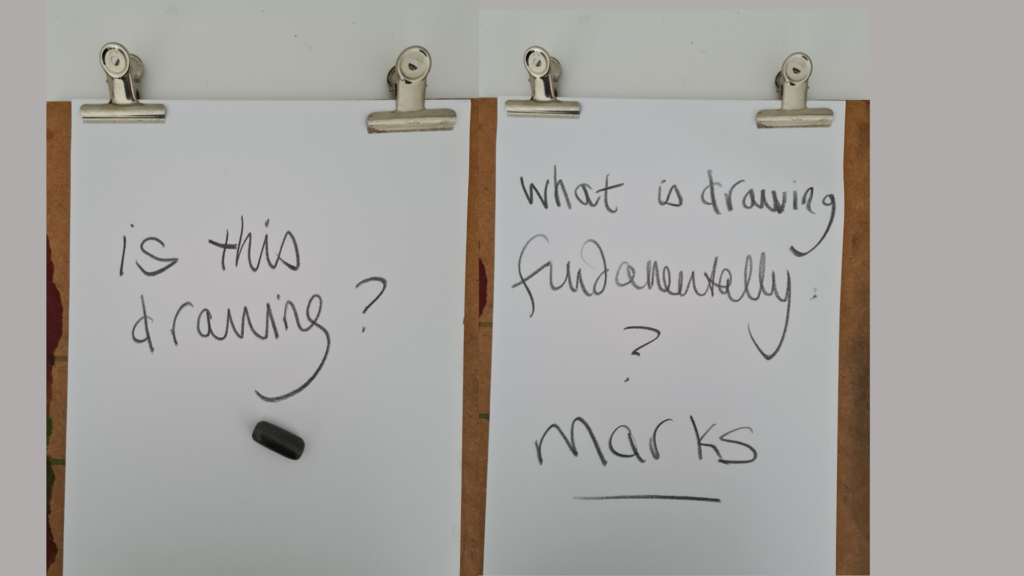
During the FMS TEL Conference, Leonard Shapiro of the University of Cape Town presented an overview of the many ways in which people draw, dispelled myths about the ‘quality’ of a drawing, and covered some of the many ways in which drawing can be useful in learning and in communication once we stop judging ourselves on our artistic skill.
The university has a range of tools that allow us to draw for learning and communication, and draw collaboratively when teaching in person and online, such as smart boards, interactive whiteboards, and collaborative whiteboards in Zoom and Teams, as well as note making apps on devices we have in our pockets.
Drawing as a method to understand 3D anatomical structures is central to Leonard’s work – how might drawing allow your students to take a different viewpoint in your subject?
You may also wish to consider the approaches and methods used in the other linked FMS TEL videos below:
The team shares success at the Learning and Teaching Conference – find out more about how DIY and bespoke animations can help boost learning in your course.
Several members of the FMS TEL team attended the NU Teaching & Learning Conference on Thursday 31st March giving strong representation of the team.
It was a great day with some very insightful presentations on a broad range of topics and a very interesting keynote from Professor Paul Ashwin. It was also the first time in years that the conference has been able to be run ‘in person’ and with around 300 attendees it felt like a slight return to normality.
Members of the FMS TEL team had both ‘posters’ and ‘video presentations’ entered into the competitions. Attendees were sent a link to view them and were able to vote for their favourites both in the week leading up to the conference and also on the day itself.
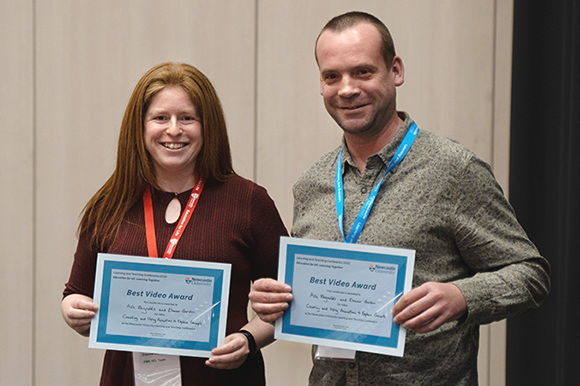
Eleanor Gordon (left) and Ashley Reynolds (right)
Ashley Reynolds and Eleanor Gordon from the FMS TEL team were delighted to be announced winners of the ‘Best Video Award’ for their video presentation titled ‘Creating and using animations to explain concepts’ which highlighted how animations could be used to enhance teaching, and techniques that will both improve memory retention and also increase learner engagement. The video presentation entry can be seen below.
Video submission
If you would like to know more about animations and the services that the team can offer, please get in touch.
We would like to say ‘Thank you very much’ to the LTDS team for organising a great conference. Can’t wait for next year!
A video explanation and demonstration of how animations can be used to explain concepts, and when this is most effective.
Teaching and Learning Conference Presentation
Ashley Reynolds and Eleanor Gordon
This video demonstrates how animations can be used to enhance teaching. Some animations require specialist experience to create, but a great deal can be achieved by adding purposeful animations in PowerPoint, or utilising H5P.
Animated diagrams are a rich resource for explaining processes and relationships. Online teaching sometimes means that gestures such as pointing, highlighting and demonstrating motion are lost. Including these dynamic elements in presentations boosts understanding of concepts and processes when compared with static images. (Goff et al., 2017).
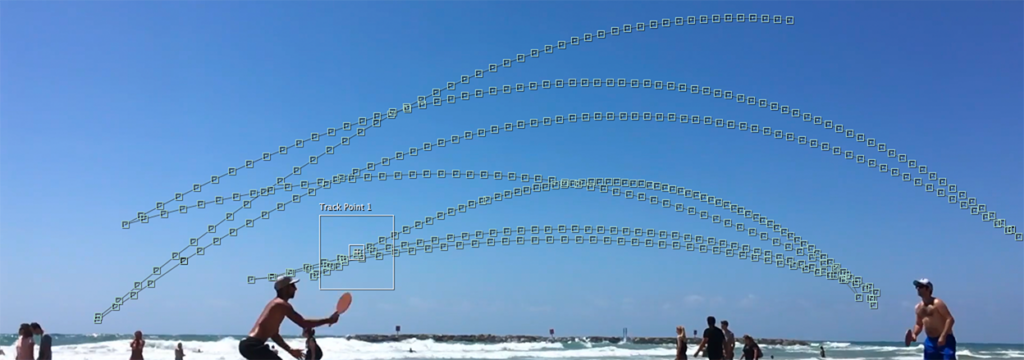
This post shows how cursor movement can be used in online presentations to show gesture, and the skills needed to add motion tracked items to video.
As part of the recently launched Exploring 3D Anatomy MOOC, two video presentations were created. These presentations involved explaining diagrams and pictures. One of these recordings had a moving cursor which the presenter had used to explain various parts of the screen, and the other was recorded without a cursor. To improve the clarity of the explanations, we had a request to display a larger cursor over the recorded material, using it to ‘point’ to the various significant areas shown.
When you’re planning a virtual presentation it’s worth checking if and how the software handles the cursor – some software will use a glowing highlight as you present, some will show and hide the cursor automatically depending on when you move it. The videos were recorded in ReCap, which automatically hides the cursor unless it is moving. The end of the post has links to various guides to help you choose your settings. The rest of this post details the animation process for how a larger cursor was added after the presentations had been recorded. This technique could be applied to other added graphical elements too if needed.
Creating the New Cursor
As the cursor is used in a lot of animations, there was already a scalable vector graphic image of a cursor available to use. This had been drawn in Adobe Illustrator. The next step was to use After Effects to add the cursor to the video and animate it.
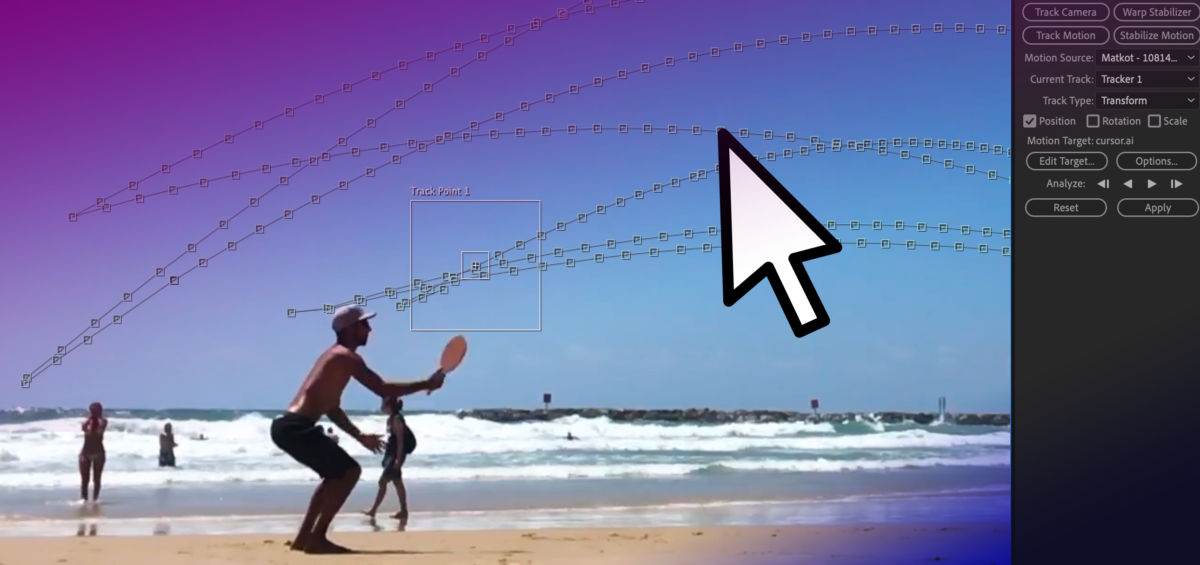
Tracking the Cursor
For the video with the cursor visible, the motion tracking function of After Effects was used. After identifying the original cursor, the new larger cursor was set to track it. Here and there the original cursor changed colour to remain visible over different backgrounds. It wasn’t necessary to replicate the colour change with the larger cursor, but this colour change did add extra steps when setting up the motion tracking as it needed to be started afresh each time the original cursor had changed colour. For the video without the cursor, the process was simpler as there was nothing to hide or track. As such the animations could be set up from scratch. Based on the clear explanation from the presenter, it was possible to add a cursor to trace the areas being explained.
Adding the New Cursor
The animations were set up to take place between certain moments of the video – like scenes. Key points in the video were identified and ‘key frames’ added which allow us to set up when certain animations should take place, and how long for. Simple animations such as changing size, position or rotation can be done relatively quickly using these linear key frames.
Once the start and end points are set, further customisation can be done to change the feel of the animation. For example, in this case, the speed of the cursor should somewhat mimic a natural movement rather than a precisely uniform speed. Using ‘ease in’ and ‘ease out’ (combined as ‘easy ease’) allows for the animation to look a little more natural, and less jarring, as the cursor starts to move more slowly before speeding up and gradually slowing to a stop.
When moving from point to point it’s very rare that a straight line is the best path to take, usually a slightly curved path can help add a more natural-looking movement. This might be used to instruct a viewer to click a series of buttons, for example. The ‘spatial interpolation’ in After Effects allows for the path of the moving object to be linear (a straight line) or Bezier (curved). The temporal interpolation tool allows for variations to the speed of the movement – a more customisable version of easing. Adjusting these allows for a nice natural pace and movement, and for more creative effects. For example an item moving from A to B may move slowly at first, then speed up towards the middle of its journey, then slow down again before arriving at its final destination – imagine a train travelling between stations!).
In this video the cursor was hidden from screen for most of the video so it was animated manually.
In this video the cursor was tracked (while visible), note the more erratic movement.
Approximating Gesture
The final videos allowed for a clear approximation of gesture to be added to the presentations, mimicking how a presenter might usually point to a screen or demonstrate a movement. While this is something very natural to do in person, you may need to think more about how you use and move your cursor in online presenting. Often it can be tricky to see the cursor, so you may wish to consider moving it more slowly than usual if you are using it to indicate processes or changes. Selecting some form of pointer or cursor highlighting in your chosen software can improve the visibility of the cursor during your presentation, whether recording or in person. On the other hand, you may wish to put your mouse out of reach so that random or accidental cursor movements don’t detract from your content.
Motion Tracking Demonstration
This video demonstrates the full motion tracking procedure, showing how you can track an object and then map the position of a cursor to it.
Resources
Cursors on Panopto – remember that only the slides are captured if you add a PowerPoint, so to capture your cursor, you should record your screen instead.
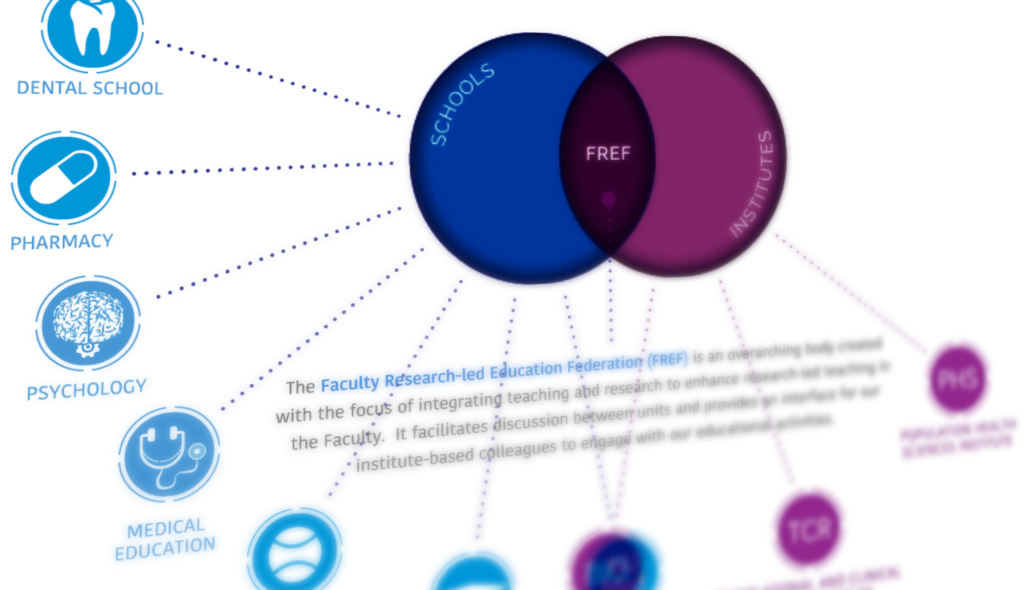
The Learning and Teaching Team contacted us to request an animated diagram showing the relationship between various areas of work, including faculty schools, institutes, and the Faculty Research-led Education Federation (FREF). The resulting page is visible to Newcastle staff here – take a look before reading the rest of the post.
The initial brief included a PowerPoint with the required information, as well as a mock-up of how the final animation could look. As this content was being built within SharePoint, there were certain technical restrictions on what could be done. For example, the site template has a fixed width, and animations cannot be created natively within it. The interactive diagram also needed buttons and links added that would both display additional item information, and also take users to different areas of the site when clicked, such as school and institute homepages.
These requirements meant that the animation needed to be created separately and then shared, and an HTML 5 canvas based animation was the best choice (not to be confused with our VLE Canvas!).
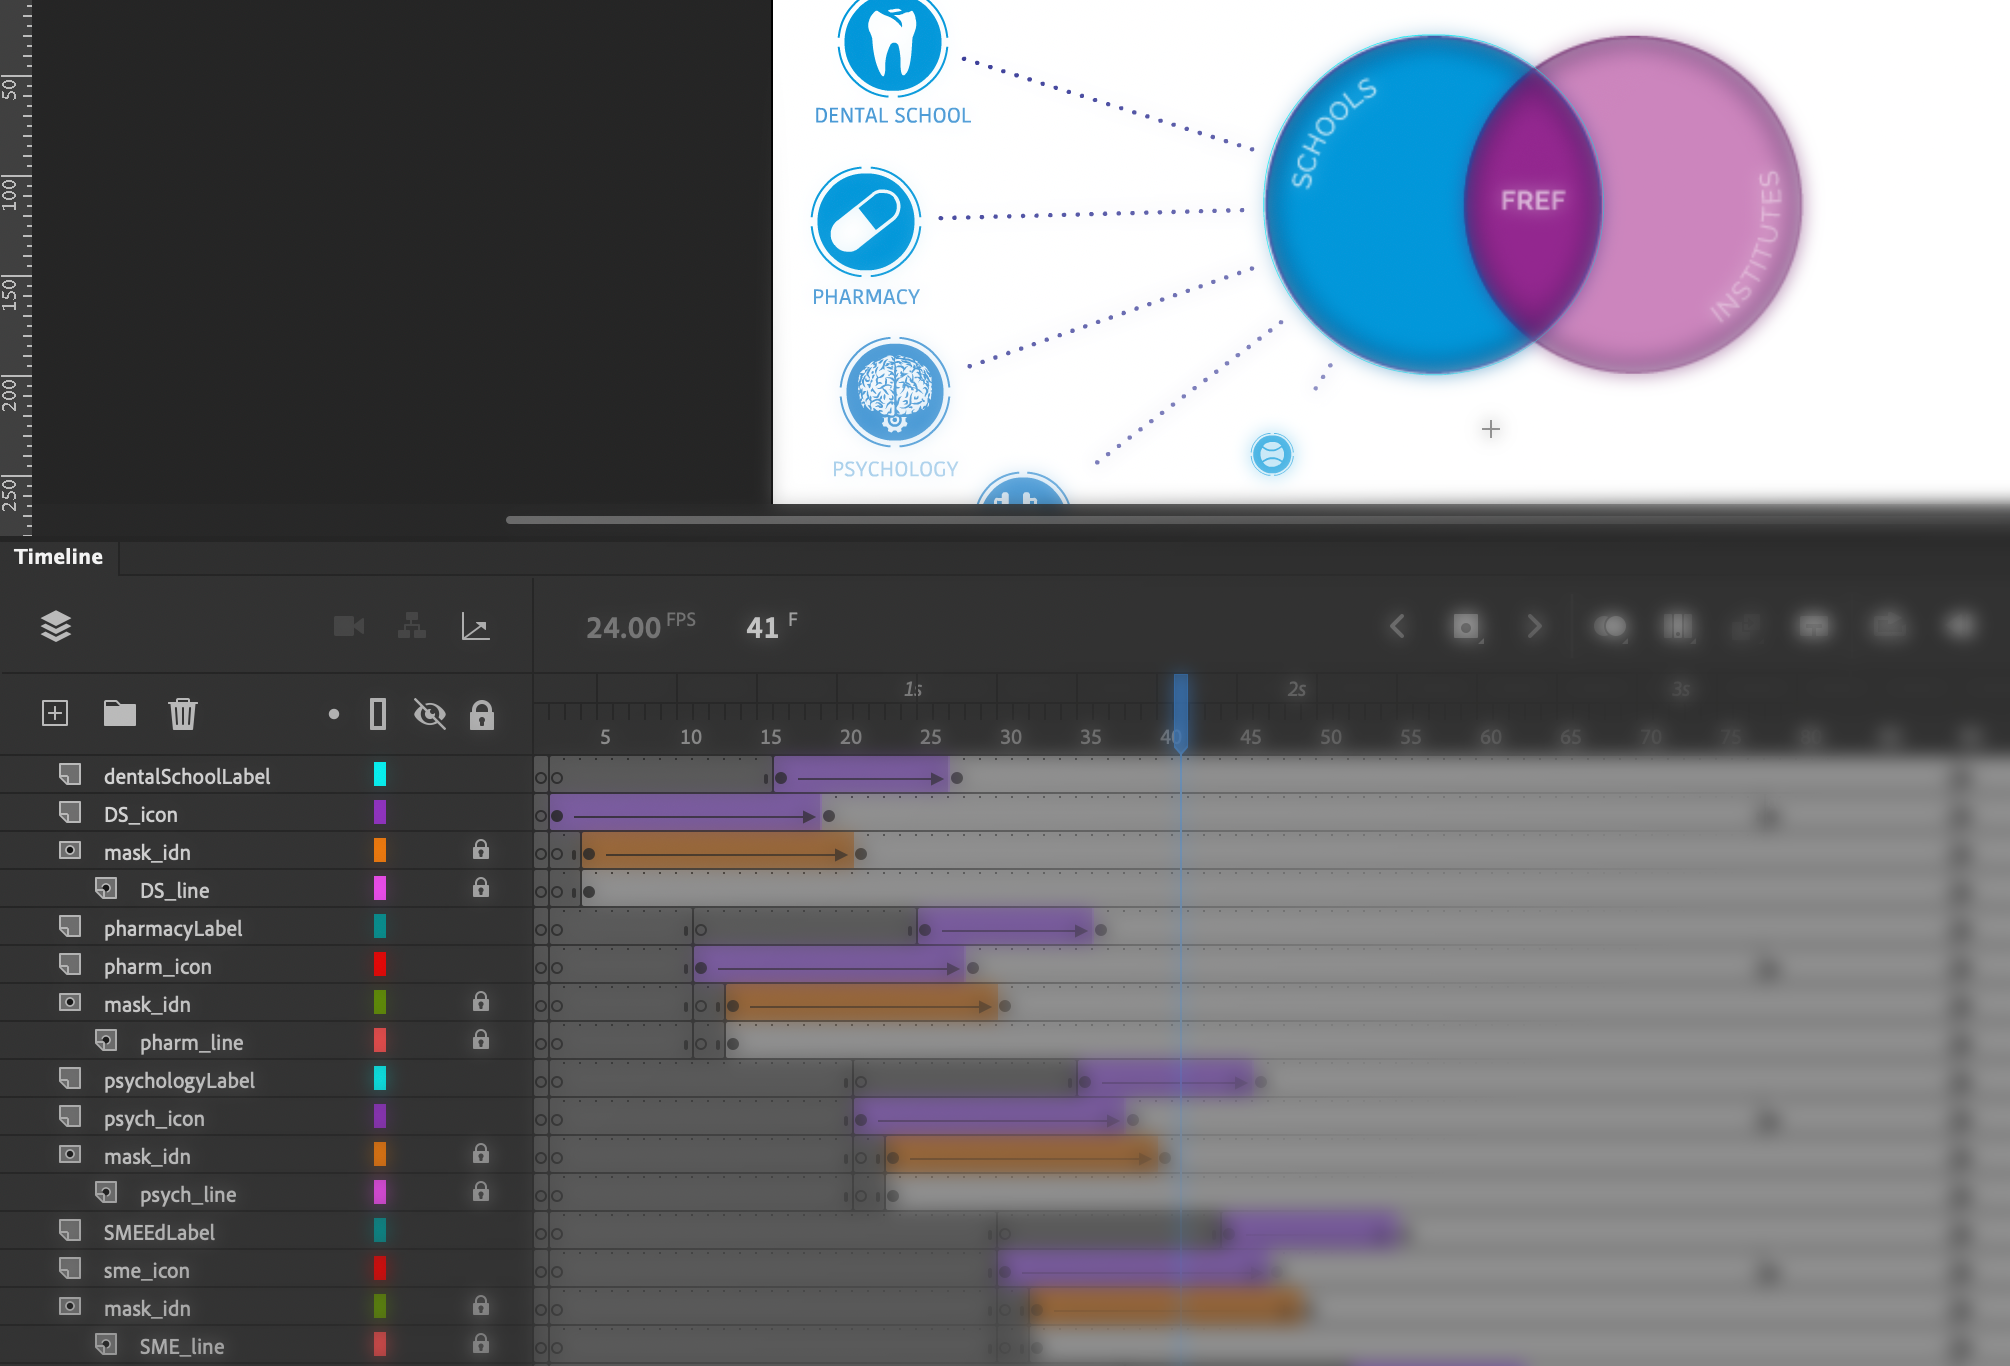
Working from the requirements for the layout, icons were designed/created to match each school and institute. These icons were designed in Adobe Illustrator. Once these had been approved, they were then imported into Adobe Animate where the animation and programming processes began.
Some elements of the animation, such as moving an object or changing its size can be done very simply in Animate with its inbuilt tools and timeline-based animation, however extra coding is needed in some cases, for example when checking variables or adding links and hotspot areas.
After a second round of consultation and changes, the final animation could be uploaded to our teams e-learning repository and then an embed code provided to enable it to be placed on the SharePoint site. The resulting diagram shows how the many organisations inter-relate and allows for a large amount of information to be shared in a relatively small space. Showing everything at once would not be practical. The animation itself cannot be easily understood by accessibility software, however the information is easily accessible via alternative menus on the page.
sample animation of interactive diagram
In this animation, the first stage shows the building of the initial stages of the diagram, and an animated cursor encourages viewers to interact with each section. Next, the three key areas of the Venn diagram become interactive (changing colour as users’ mouse over with a pointer cursor) and users can click around the diagram to explore the further information and link out to the various school/faculty pages. The use of the cursor pointer and the colour change clearly highlights the interactivity to the user.
There are a wide range of alternative uses for this type of diagram, which is commonly used for categorising. Adding the interactive hotspot elements opens up further possibilities, where each individual item can be further explored.