See an overview of some highlights of the conference for you, depending on your role and your interests.
Not many of you would have time to attend all 16 sessions running this year, from 7th-11th November – here are some sessions you may like to join, depending on your interests.
Clinical colleagues and colleagues who don’t teach often
Spend Monday catching up on developments and reminding yourself of university systems by attending the Welcome and Keynote, and boost engagement with accessibility and Canvas overviews. Dip into Lightning Talks on Tuesday and Friday for bite-size guides to our current technology and teaching practice.
How about trying some 3D Scanning on Monday and learning how Augmented Reality is being used in various areas of the university. Later in the week, see how the recently-implemented H5P plugin for Canvas has been used to create digital escape rooms for students.
The FMS TEL Conference 2022 is now open for booking. With 16 sessions across five days, there’s sure to be something to suit your interests and your timetable.
Sessions will run from 8am-1pm GMT / 4pm-9pm MYT, with sessions running in person in Newcastle, live-streamed, or in online formats.
Timetable at a glance:
Monday: Keynotes, Accessibility, Captions, Canvas, 3D Scanning
Tuesday: Lightning Talks, Augmented Reality and Journal Club
Wednesday: Supporting Labs with Learning Technologies, Microsoft Forms
Thursday: PowerPoint Animations, Making a MOOC
Friday: HTML for Canvas, Lightning Talks, Adaptive Feedback
You can see full details of the session details and book via conference page. Looking forward to seeing you all there!
As the newest member of FMS TEL. I get the chance to see the products offered by the unit from a different perspective compared to the end user and the existing development colleagues.
As the newest member of FMS TEL. I get the chance to see the products offered by the unit from a different perspective compared to the end user and the existing development colleagues. Talking about my first project, a redevelopment of a system designed and launched around 8 years ago. I can see that the current system although designed well at the time, a large part of it is no longer used or fit for purpose given growth and process changes during that period.
Part of the investigation process of any existing project is looking back at what the clients have been using and how they have been using it. This gives you insight into what’s being used and what’s not, where the priority new functionality needs to be focussed. Engagement with the previous developer adds to this an understanding of what the purpose of the system and what business needs took priority.
In defence of the previous system; I have been reaching many of the same conclusion in my development processes. Many of the ongoing issues raised by the client; at one point or another were solved and that got me thinking about what the priority was now.
At times we are our own worst enemy when it comes to systems and processes that are no longer serving us. For example, the project I am working on is getting a new tagging system to help organise the systems content. The tags can be attached too many different items to help describe the object.
The tag can also filter the data display, such as being able to select everything with a specific tag in the database. Tags will likely reduce the frequency of updates required too by giving the user the ability to add new database queries by adding a tag to the objects.
This is quite a simple yet powerful feature to put in place for a developer and one that many systems use to provide similar functionality for the end user. But nothing is perfect and as much as I love the tagging system there’s one issue.
The more flexible the system is, the more discipline the end user needs to have to maintain its usefulness. There needs to be a unified effort by the client and the development team which ensures the integrity of the system and limits the fragmentation of the data.
How can we solve this? Well, the end user needs to ensure they are naming the tags something that best matches what they are aiming to do. On top of that everyone in the team need to follow the agreed guidelines too.
For example, say we have event 1,2 and 3. I want to use a tag that best describes them so let’s make a tag called ‘Numerical event’. We tag all three of them. Now I go on holiday and event 4 happens and someone who is covering for me tags this event ‘Numbered Event’. We now have two tags that are similar that are describing two different sets of events, not ideal.
A conscious effort to review what we are achieving during development, but also once in the open with the end user will be crucial to keeping this kind of system working for us.
We will wait and see after the system is handed to the client in December, what worked and what didn’t. Review, enhancements and re-development are inevitable to limit this becoming another system that works against you!.
How to manage and track your downloads from Microsoft Teams.
Video content created for the e-learning modules in FMS is often shared between colleagues in Teams. A problem I have come across is the lack of a progress bar within Teams for downloads.
When downloading a small file, such as an image or a document, it is not really a problem. You get a pop up notification of the download starting and shortly after a similar pop up notification saying the download is complete.
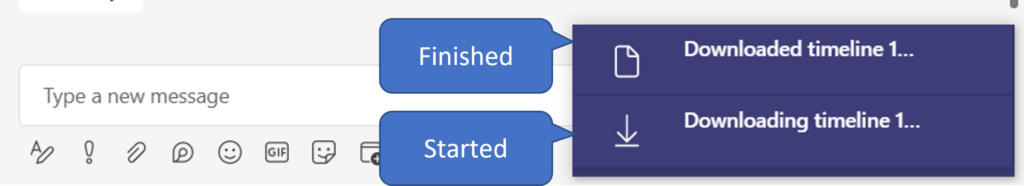
Screenshot of teams download notifications
If you are downloading a larger file such as 1 hour+ videos, which may take a while to download, you are left in limbo for how long it will take and if you move away from your screen you may miss the pop up notification entirely.
One solution is to keep an eye on the files icon on the teams navigation pane. It will be blank by default, show a downward arrow when downloading and briefly show a green tick when downloads are complete.
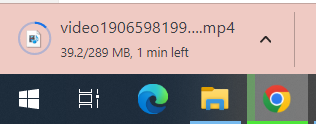
Teams File Icons
A second solution is to download the file from SharePoint instead. If you right click the file you should see an option to Open in SharePoint (this only works in teams areas, not chats). From SharePoint, select your file and click download. Your download will be controlled by your chosen browser.
In Chrome the progress bar displays the size and time limit left and the icon on the task bar turns into a progress bar as well. With this method I can get on with other tasks while the file downloads and be aware of its progress as well. I can also cancel the download if I need to.
The FMS Technology Enhanced Learning Conference 2022 will run in the week beginning 7th November. We would like to invite all members of staff – Professional Services, Clinical, Teaching and Research – in FMS and NUMed to showcase their work in teaching and learning, whether this is in the classroom, online, or managing things behind the scenes.
Conference themes include:
Video and Beyond – Virtual and Augmented Reality, Animations, 3D Scanning and Printing
Work Smarter – Improving our workflows, shortcuts, efficiency in processes.
Continuous Professional Development – Developing and implementing CPD
Digital Assessment
Submissions close at the beginning of October. Please check out the Conference Page for full details.
In addition to the FMS TEL Team, confirmed speakers and events include…
Prof Ruth Valentine, Dean of Education, FMS
Dr David Kennedy, Dean of Digital Education
Dr Paul Hubbard, Associate Dean of Academic Affairs, NUMed
This post covers the pros and cons of different ways to upload and manage files in Canvas
As the e-learning modules in FMS are now going live, the team have been looking at ways to manage uploaded files in Canvas.
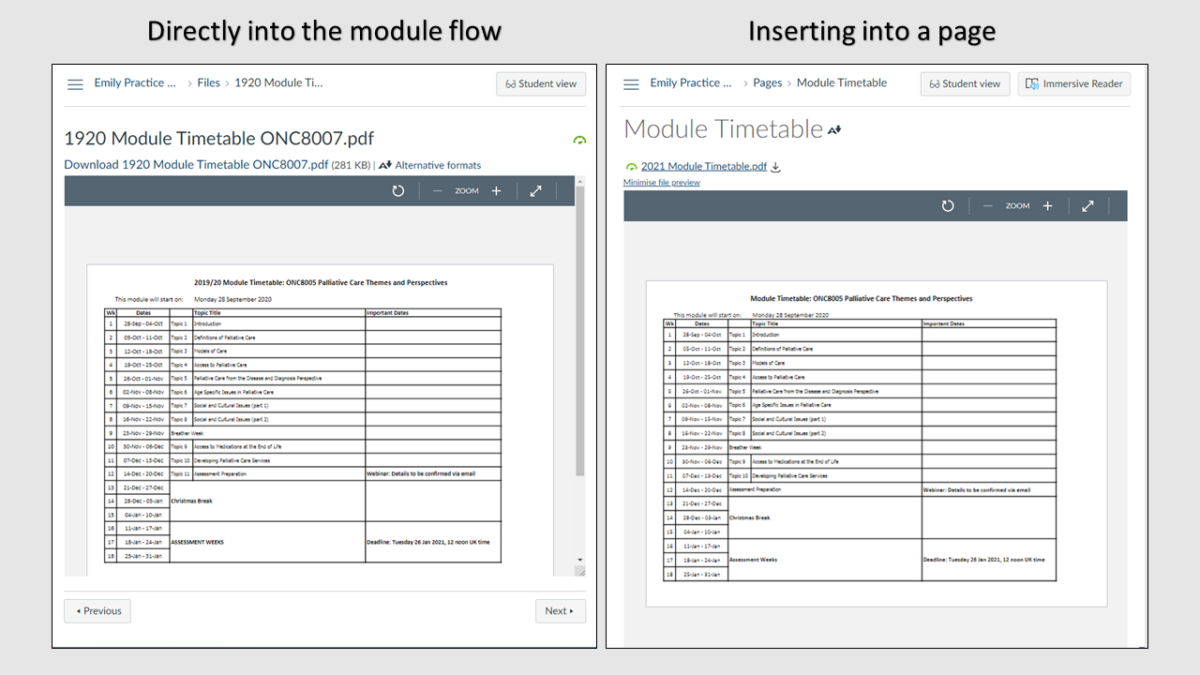
There are two main ways to add files to your module flow in Canvas:
Directly into the module flow
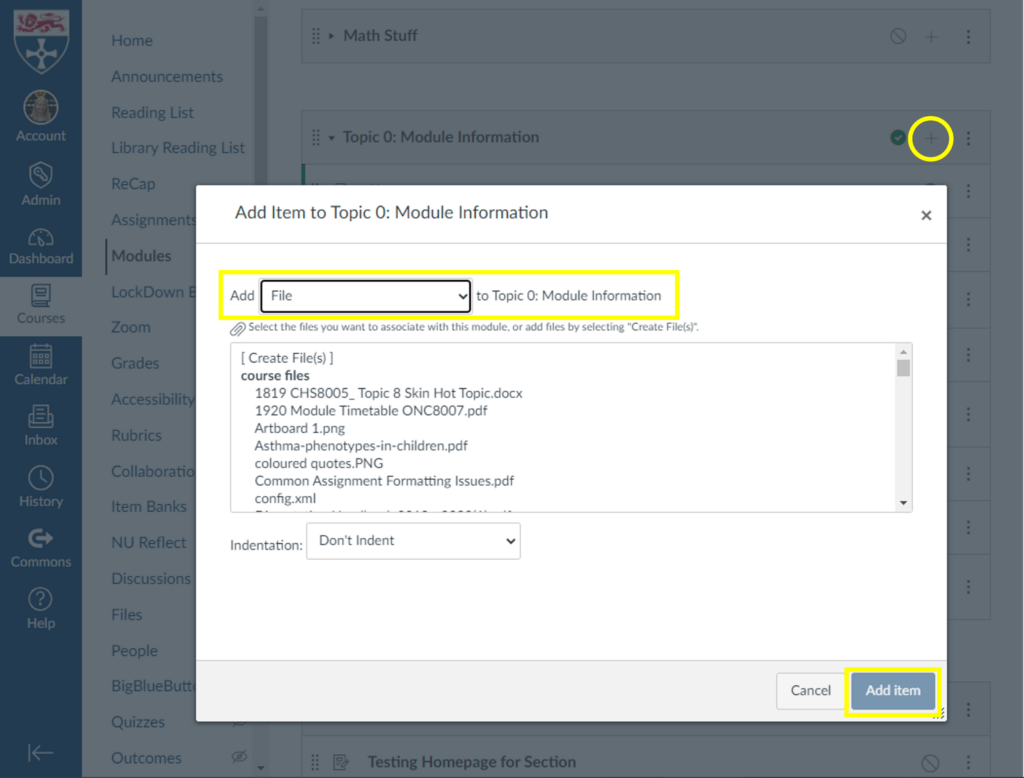
+ > Add File > Add Item
This method is by far the easiest and quickest way to add a file to your course, and is a great choice if the file will not require updates.
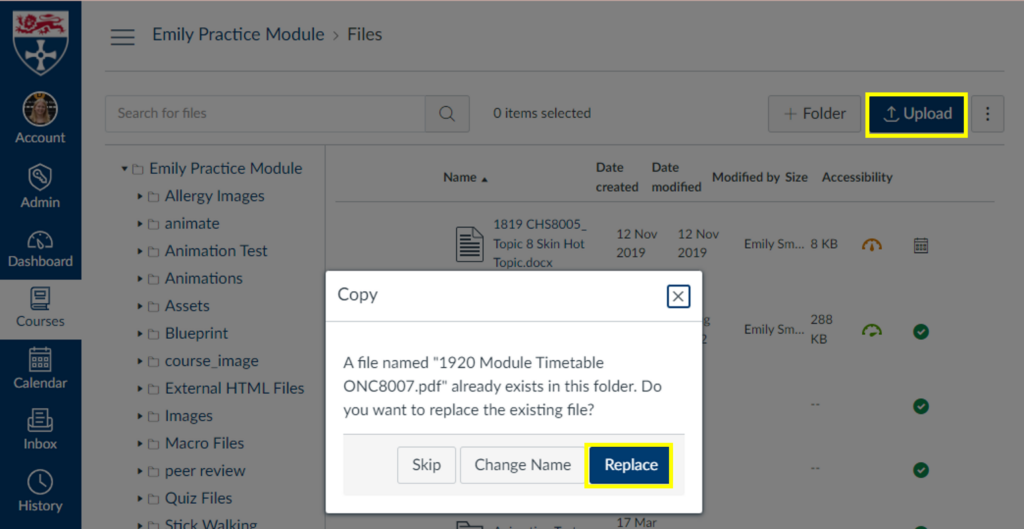
If you need to replace the file with an updated version, it is best practice to upload the new version directly to the files area and replace the original file. The file names need to be identical and uploaded to the same folder for the “replace” option to appear. Updating the file this way means any links to the file within the content will not need updated.
Upload > Replace
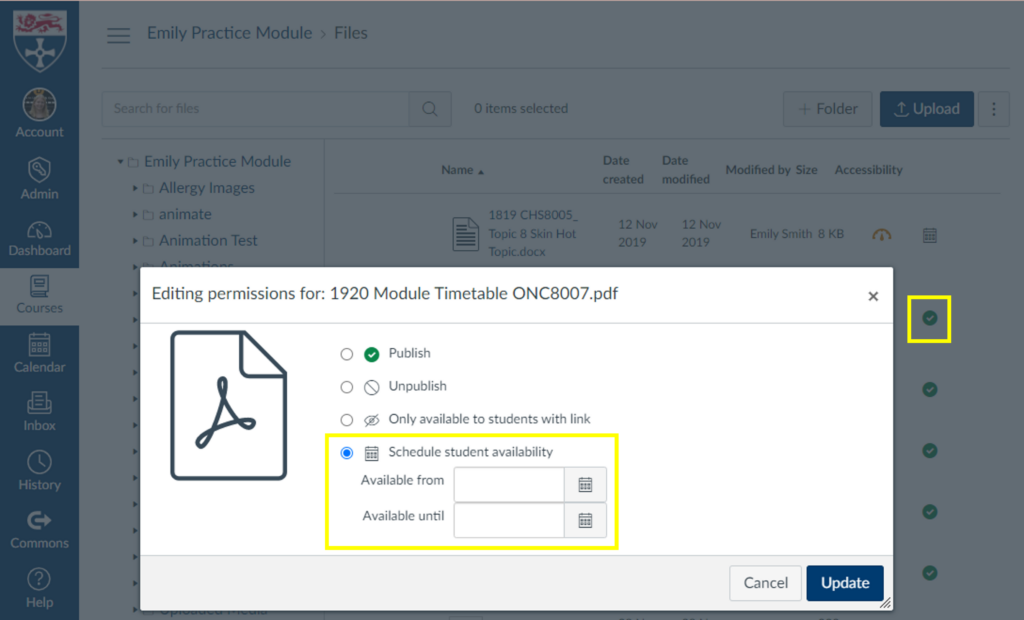
In the files area you also have the option to adjust the availability of files, including adding available from and until dates.
Click the green tick next to the file to open the availability options
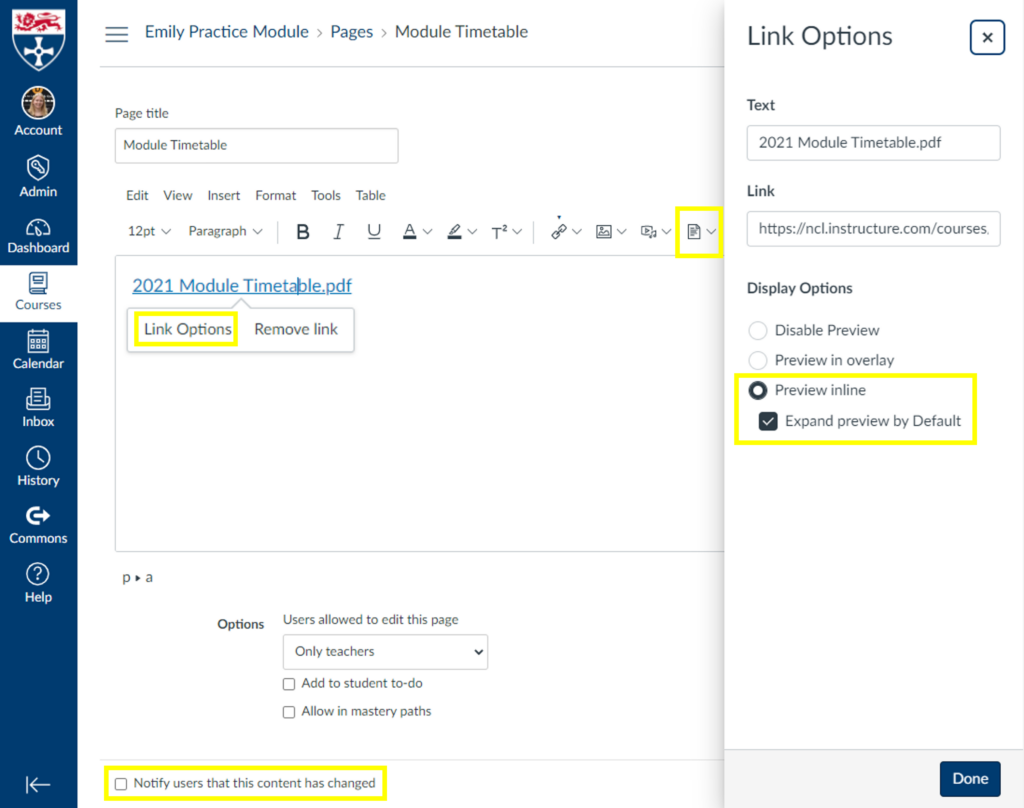
Inserted into a page
View of options available for a file inserted into a page in Canvas
This is my preferred method for adding a file to a course. You can use ‘Link Options’ to make the file open a preview by default so the page has the appearance of a directly added file but you have the following benefits over adding the file directly:
Able to add notes or comments above or below the file
The page title does not have to be the file name
Any links will be directed to this page so you can update the file/page as many times as needed and links to the content will still work
You can create an archive at the bottom of the page for previous file versions
Canvas can notify students of changes to the page/file
You have access to the page history so you can roll back to previous versions
You can add multiple files to one location
You can add a to-do deadline to the students to do lists and calendars
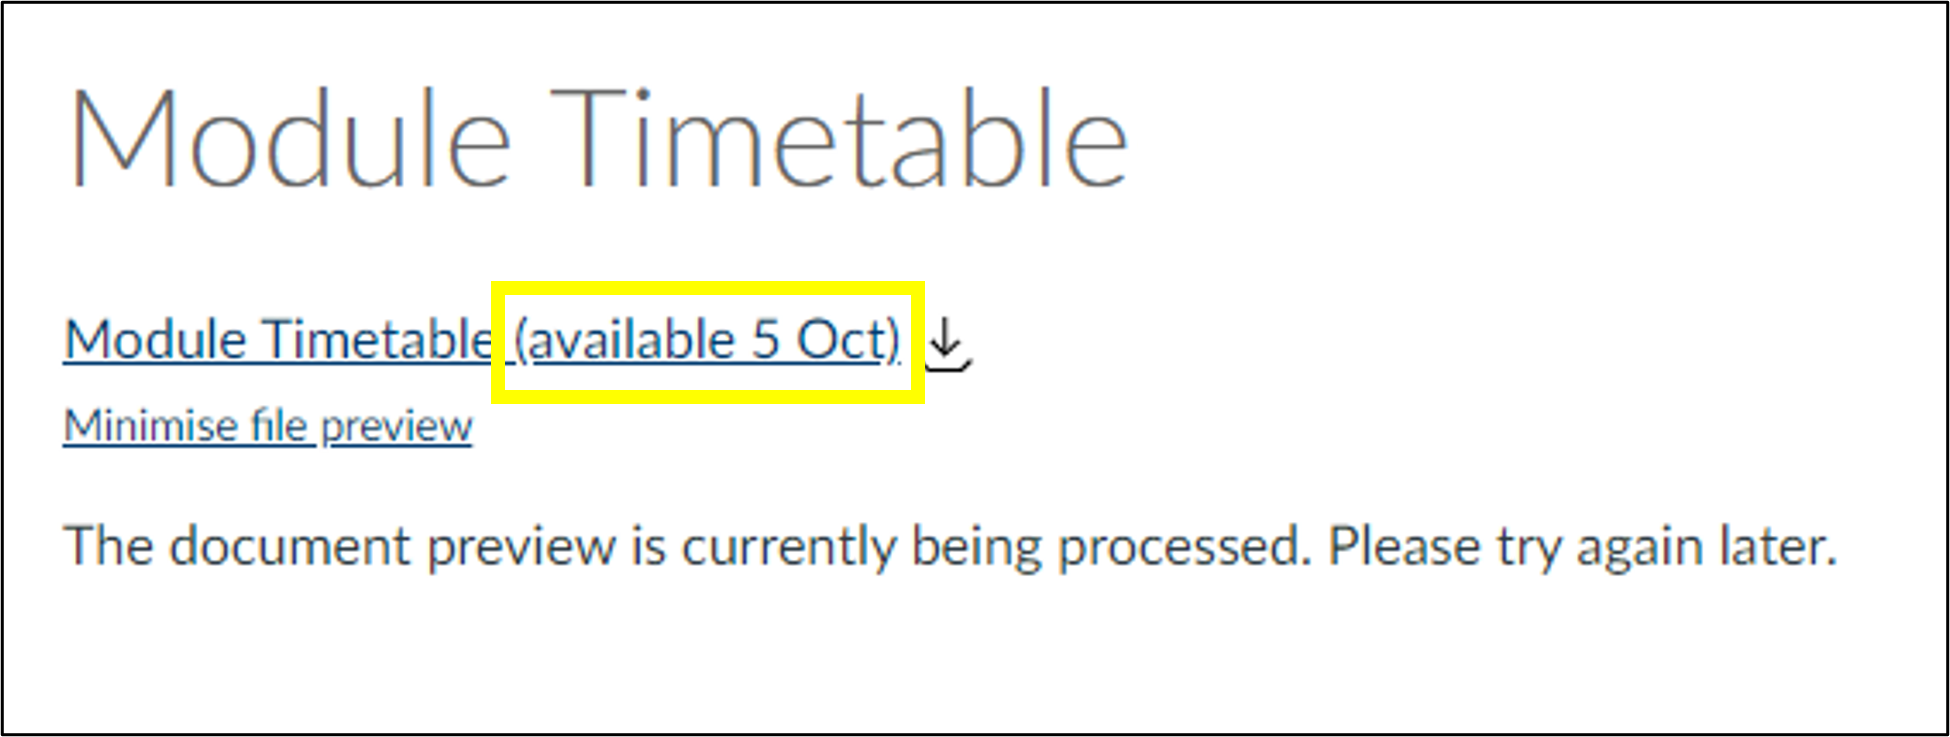
If you choose to use the file availability options mentioned in the previous method you may want to add a message on the page stating when the file will be available as the message canvas provides is not very informative:
Canvas Message: The document preview is currently being processed. Please try again later.
Keeping track of your files and file names within your module helps you save time and avoid confusion later.
Quick wins in accessibility by using Adobe Acrobat Pro’s built-in tool.
In FMS TEL we are currently working on accessibility as new module materials are being prepared for release. Did you know that Adobe Acrobat Pro has a built in Accessibility tool that not only checks your document’s accessibility, but helps you improve accessibility with the click of a few buttons?
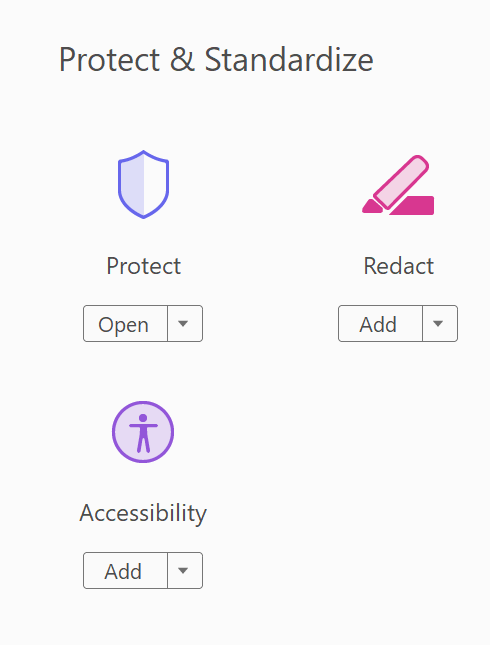
If you find that your PDFs are receiving low accessibility scores in Canvas, you can use Adobe Acrobat to improve their scores quickly and efficiently. Simply open the file in Adobe Acrobat Pro. Then select the Accessibility tool from the Tools options. (Click on More Tools then scroll down to the Protect and Standardize section.)
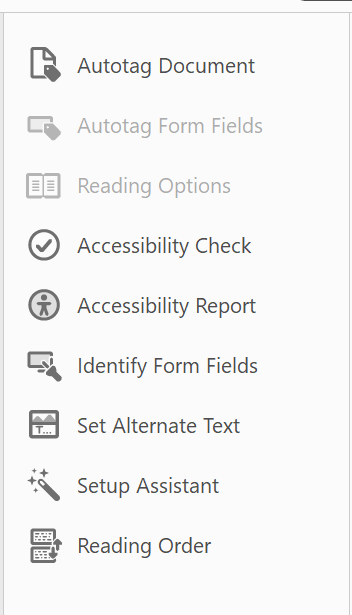
Begin by selecting the Accessibility Check. This will tell you what can be improved in your document.
Next you can use the Autotag tool if your document is missing tags such as headings.
You can choose Set Alternative Text to add alt text to your images.
If necessary use the Reading Order tool to set the order in which the document should be read by a screen reader.
With these three easy steps you have vastly improved the accessibility of your document! Try adding it back into Canvas and you will be surprised by the results you get.
If you need to produce captions and a transcript, complete the caption editing first and then use the corrected caption file as your starting point for your transcript. Creating a transcript with the method below will not give you a file that can be used for captions.
When creating a transcript, you will need to decide a few things before you start.
Are timings important, and if so, what level of accuracy do you need? Does every utterance need a time, or would it suffice to signal timing points at the start of each slide, for example?
Is it important to know who is speaking? Training videos may not need this.
The first step is to download your caption file and copy and paste the text into Word. Then, transform your lines of text into a table using ‘convert text to table‘ and setting the number of columns to 4.
Copy your table from Word and paste it into Excel. Once this is done, you can use Excel to trim down your times and make them more human-friendly, using the MID function in a new column. Copy the formula down the whole row to quickly tidy all of the timestamps. This example trims the hours from the start time, and gets rid of the milliseconds and the end time completely.
The formula above (typed into B1) will look in A1 for the source text, and starting with the 4th character, output 5 consecutive characters into the cell, and then stop. You can change the numbers if you need a different segment or more characters, for example, if you want the hours included.
Pasting the resultant data back into Word means you can then use Word’s formatting tools to shape your transcript, adding columns as needed to denote speakers or other important information, and removing columns that contain redundant data.
Cutting and pasting the individual cells containing speakers’ words into a single cell will help improve the look of the document. Paste without formatting to combine the cells into one. Spare rows can then be deleted. Using Find and Replace to get rid of line breaks (search for ^p) and replacing them with spaces further tidies this up. You can then delete the redundant rows.
If you like, you can then remove the borders from your table. You could also set a bottom cell margin to automatically space out each row.
It is important to check your resulting transcript’s accessibility. As this method uses a table, make sure that a screen reader can read it in the correct order. You can do this by clicking into the first cell of your table and then pressing the tab key to move between cells – this is the order most screen readers will relay the text, so check it makes sense.
You can also choose to add a header row to your table to give each column a title. After adding this, highlight the row, click ‘table properties‘ and in ‘row‘ select ‘repeat as header row’. Ally in Canvas will not give a 100% score without this.
Once your transcript is formatted correctly, you can correct your text and fix mistakes in the usual way if you have not already done so for captions. The previous post on Faster Captioning has some tips and tricks to speed this up.
We are delighted to announce that the FMS TEL Conference will run again this year in the week beginning 7th November 2022!
The conference team are in the process of putting together an exciting programme with something for everyone, whatever your role in FMS or NUMed. Colleagues in FMS and NUMed will receive further information by email in due course, and all colleagues are welcome to attend.
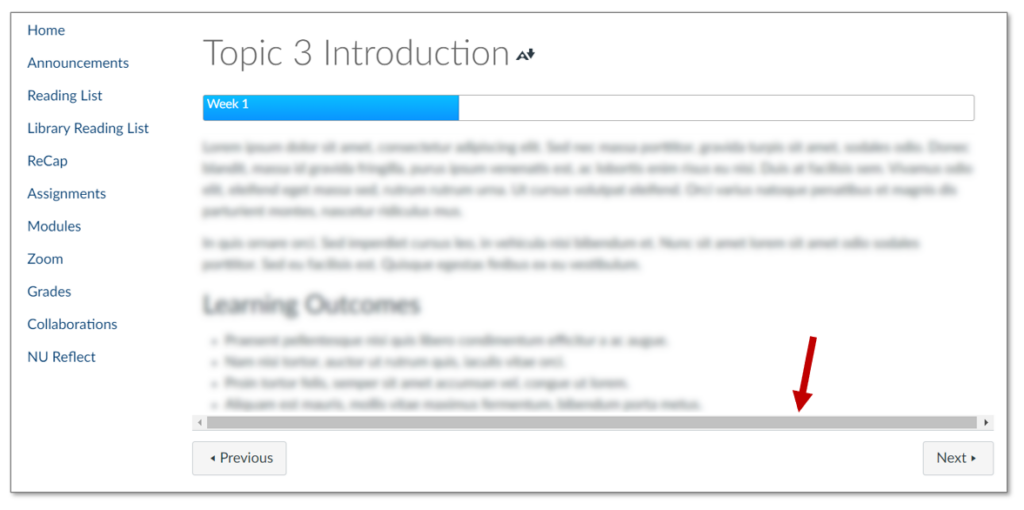
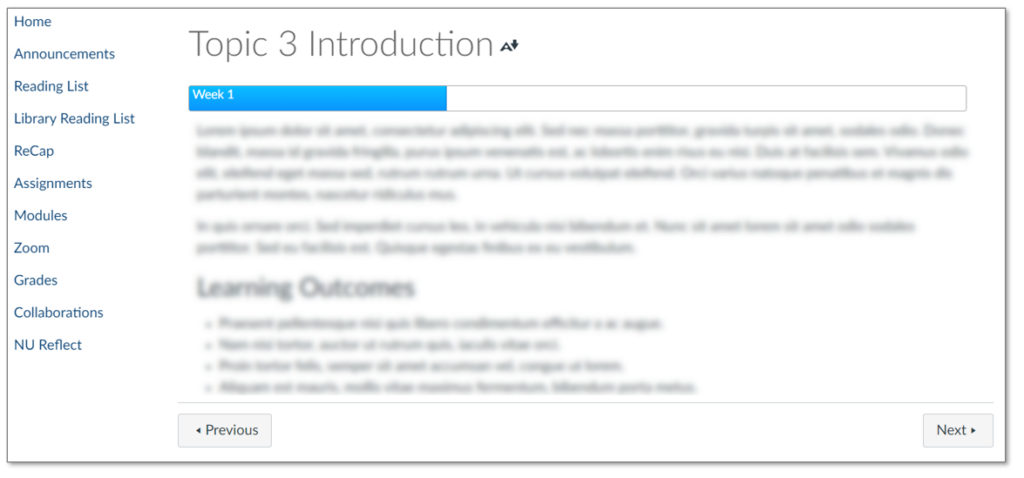
I recently noticed a few pages in my content in Canvas had developed scroll bars at the bottom. The bars were greyed out and had no function.
Scroll bar visible at the bottom of the page
I started to notice a pattern. Any content which took up the whole width of the page (100%) was triggering the scroll bars. It could be any type of content; a banner image, an embedded padlet, or like in my example progress bars.
The Fix
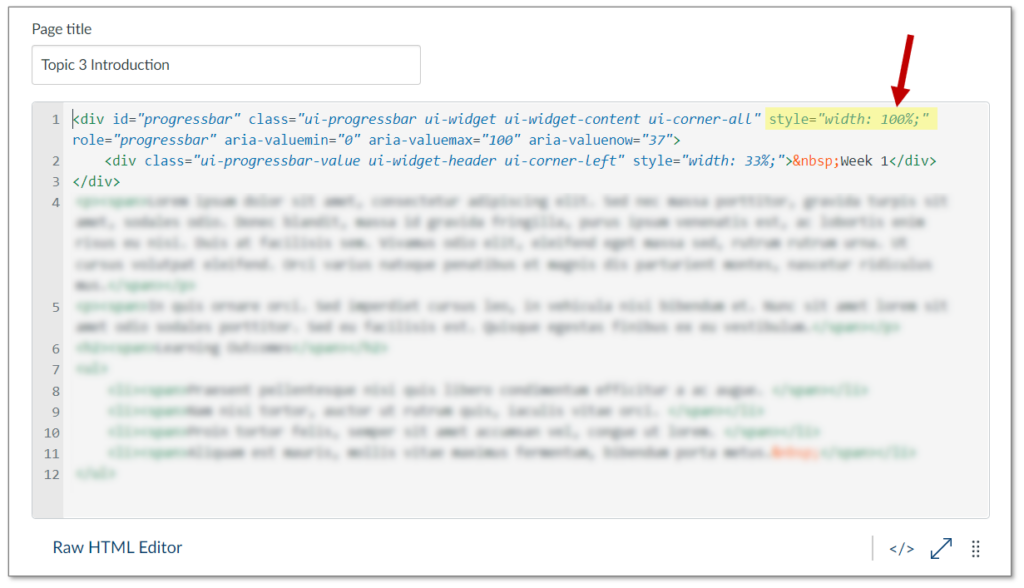
Canvas must have changed the HTML “overflow” settings somewhere on their end. An easy fix is to adjust any 100% width content to be 99% instead. This can be done in the HTML editor area accessed by this icon in the edit screen: </>
Canvas HTML editor showing width elementScroll bar has disappeared